The need for postgresql log analysis?#
While writing sql for any flow, primary focus is on the correctness of the query and not on the performance of the query. Performance issues creep in when updating/iterating a flow iteratively over multiple development cycles.Query performance is important to analyze during scaling. This is where query log analysis comes in.
In one of our cases, a complicated workflow was significantly slow when we load tested it. We were trying to figure out the bottleneck both in code structure and with query performance. Our go-to tool for query performance analysis became pgBadger.
What is a postgresql query log?#
A query log is a log of all the executed db queries. A good practice is to enable query logging on the database server. This helps in debugging and performance analysis. The query log contains the following information:
- Query
- database user
- database name
- date and time of query execution
- time taken to execute the query etc.
What is pgBadger?#
The most succinct description comes from pgBadger itself:
pgBadger is a PostgreSQL log analyzer built for speed with fully detailed reports and professional rendering. It outperforms any other PostgreSQL log analyzer.
links -
How to use pgBadger#
Install pgBadger#
brew install pgbadger
Link
Set up logging in postgresql#
There are multiple ways to do it (You can refer to pgbadger documentation for more details
pgBadger postgres configuration
):
1. Edit postgresql.conf
Edit the postgresql.conf file to enable logging. Either edit the file directly or use the ALTER SYSTEM command.
# Edit postgresql.conf
vim /usr/local/var/postgres/postgresql.conf

# OR

# Edit postgresql.conf using ALTER SYSTEM
psql -U postgres -c "ALTER SYSTEM SET log_destination = 'stderr';"
psql -U postgres -c "ALTER SYSTEM SET logging_collector = 'on';"
psql -U postgres -c "ALTER SYSTEM SET log_directory = 'logs';"
psql -U postgres -c "ALTER SYSTEM SET log_filename = 'postgresql.log';"
psql -U postgres -c "ALTER SYSTEM SET log_min_duration_statement = 0;"
psql -U postgres -c "ALTER SYSTEM SET log_line_prefix = '%t [%p]: [%l-1] user=%u,db=%d,app=%a,client=%h ';"
psql -U postgres -c "ALTER SYSTEM SET log_checkpoints = 'on';"
psql -U postgres -c "ALTER SYSTEM SET log_connections = 'on';"
psql -U postgres -c "ALTER SYSTEM SET log_disconnections = 'on';"
psql -U postgres -c "ALTER SYSTEM SET log_lock_waits = 'on';"
psql -U postgres -c "ALTER SYSTEM SET log_temp_files = 0;"
psql -U postgres -c "ALTER SYSTEM SET log_autovacuum_min_duration = 0;"
psql -U postgres -c "ALTER SYSTEM SET log_error_verbosity = 'verbose';"
Make sure you edit the postgresql.conf file and not the postgresql.auto.conf file. Postgres generates postgresql.auto.conf file and the file will be overwritten when the server restarts.
OR
2. Update docker-compose.yml
Update docker-compose.yaml file to add the following logging configuration:
mydb:
  image: 'postgres:11'
  ports:
    - '5432:5432' # machine:image
  command:
    [
      'postgres',
      '-c',
      'logging_collector=on',
      '-c',
      'log_destination=stderr',
      '-c',
      'log_directory=logs',
      '-c',
      'log_filename=postgresql.log',
      '-c',
      'log_min_duration_statement=0',
      '-c',
      'log_line_prefix=%t [%p]: [%l-1] user=%u,db=%d,app=%a,client=%h ',
      '-c',
      'log_checkpoints=on',
      '-c',
      'log_connections=on',
      '-c',
      'log_disconnections=on',
      '-c',
      'log_lock_waits=on',
      '-c',
      'log_temp_files=0',
      '-c',
      'log_autovacuum_min_duration=0',
      '-c',
      'log_error_verbosity=verbose',
    ]
environment:
  TZ: 'Europe/Stockholm'
POSTGRES_USER: 'postgres'
POSTGRES_PASSWORD: 'postgres'
POSTGRES_DB: 'db_dev'
volumes:
  - database-data:/var/lib/postgresql/data/ # persist data even if container shuts down
  - ./:/var/lib/postgresql/data/logs/ # persist logs even if container shuts down, logs will show up in the current directory
  - ./postgresql.conf:/etc/postgresql/postgresql.conf # custom postgresql config
networks:
  - default
Restart the database
docker-compose down && docker-compose up -d
Link
Generate some queries#
Start using application and generate some logs. Alternatively, generate some logs by running some queries manually OR even running load tests if available.
Run pgBadger#
Just ask pgBadger to digest logs and create a report at ./report.html.
pgbadger -I -O ./report.html ./postgresql.log
Link
View the report#
Open the report in your browser and you will see something like this:
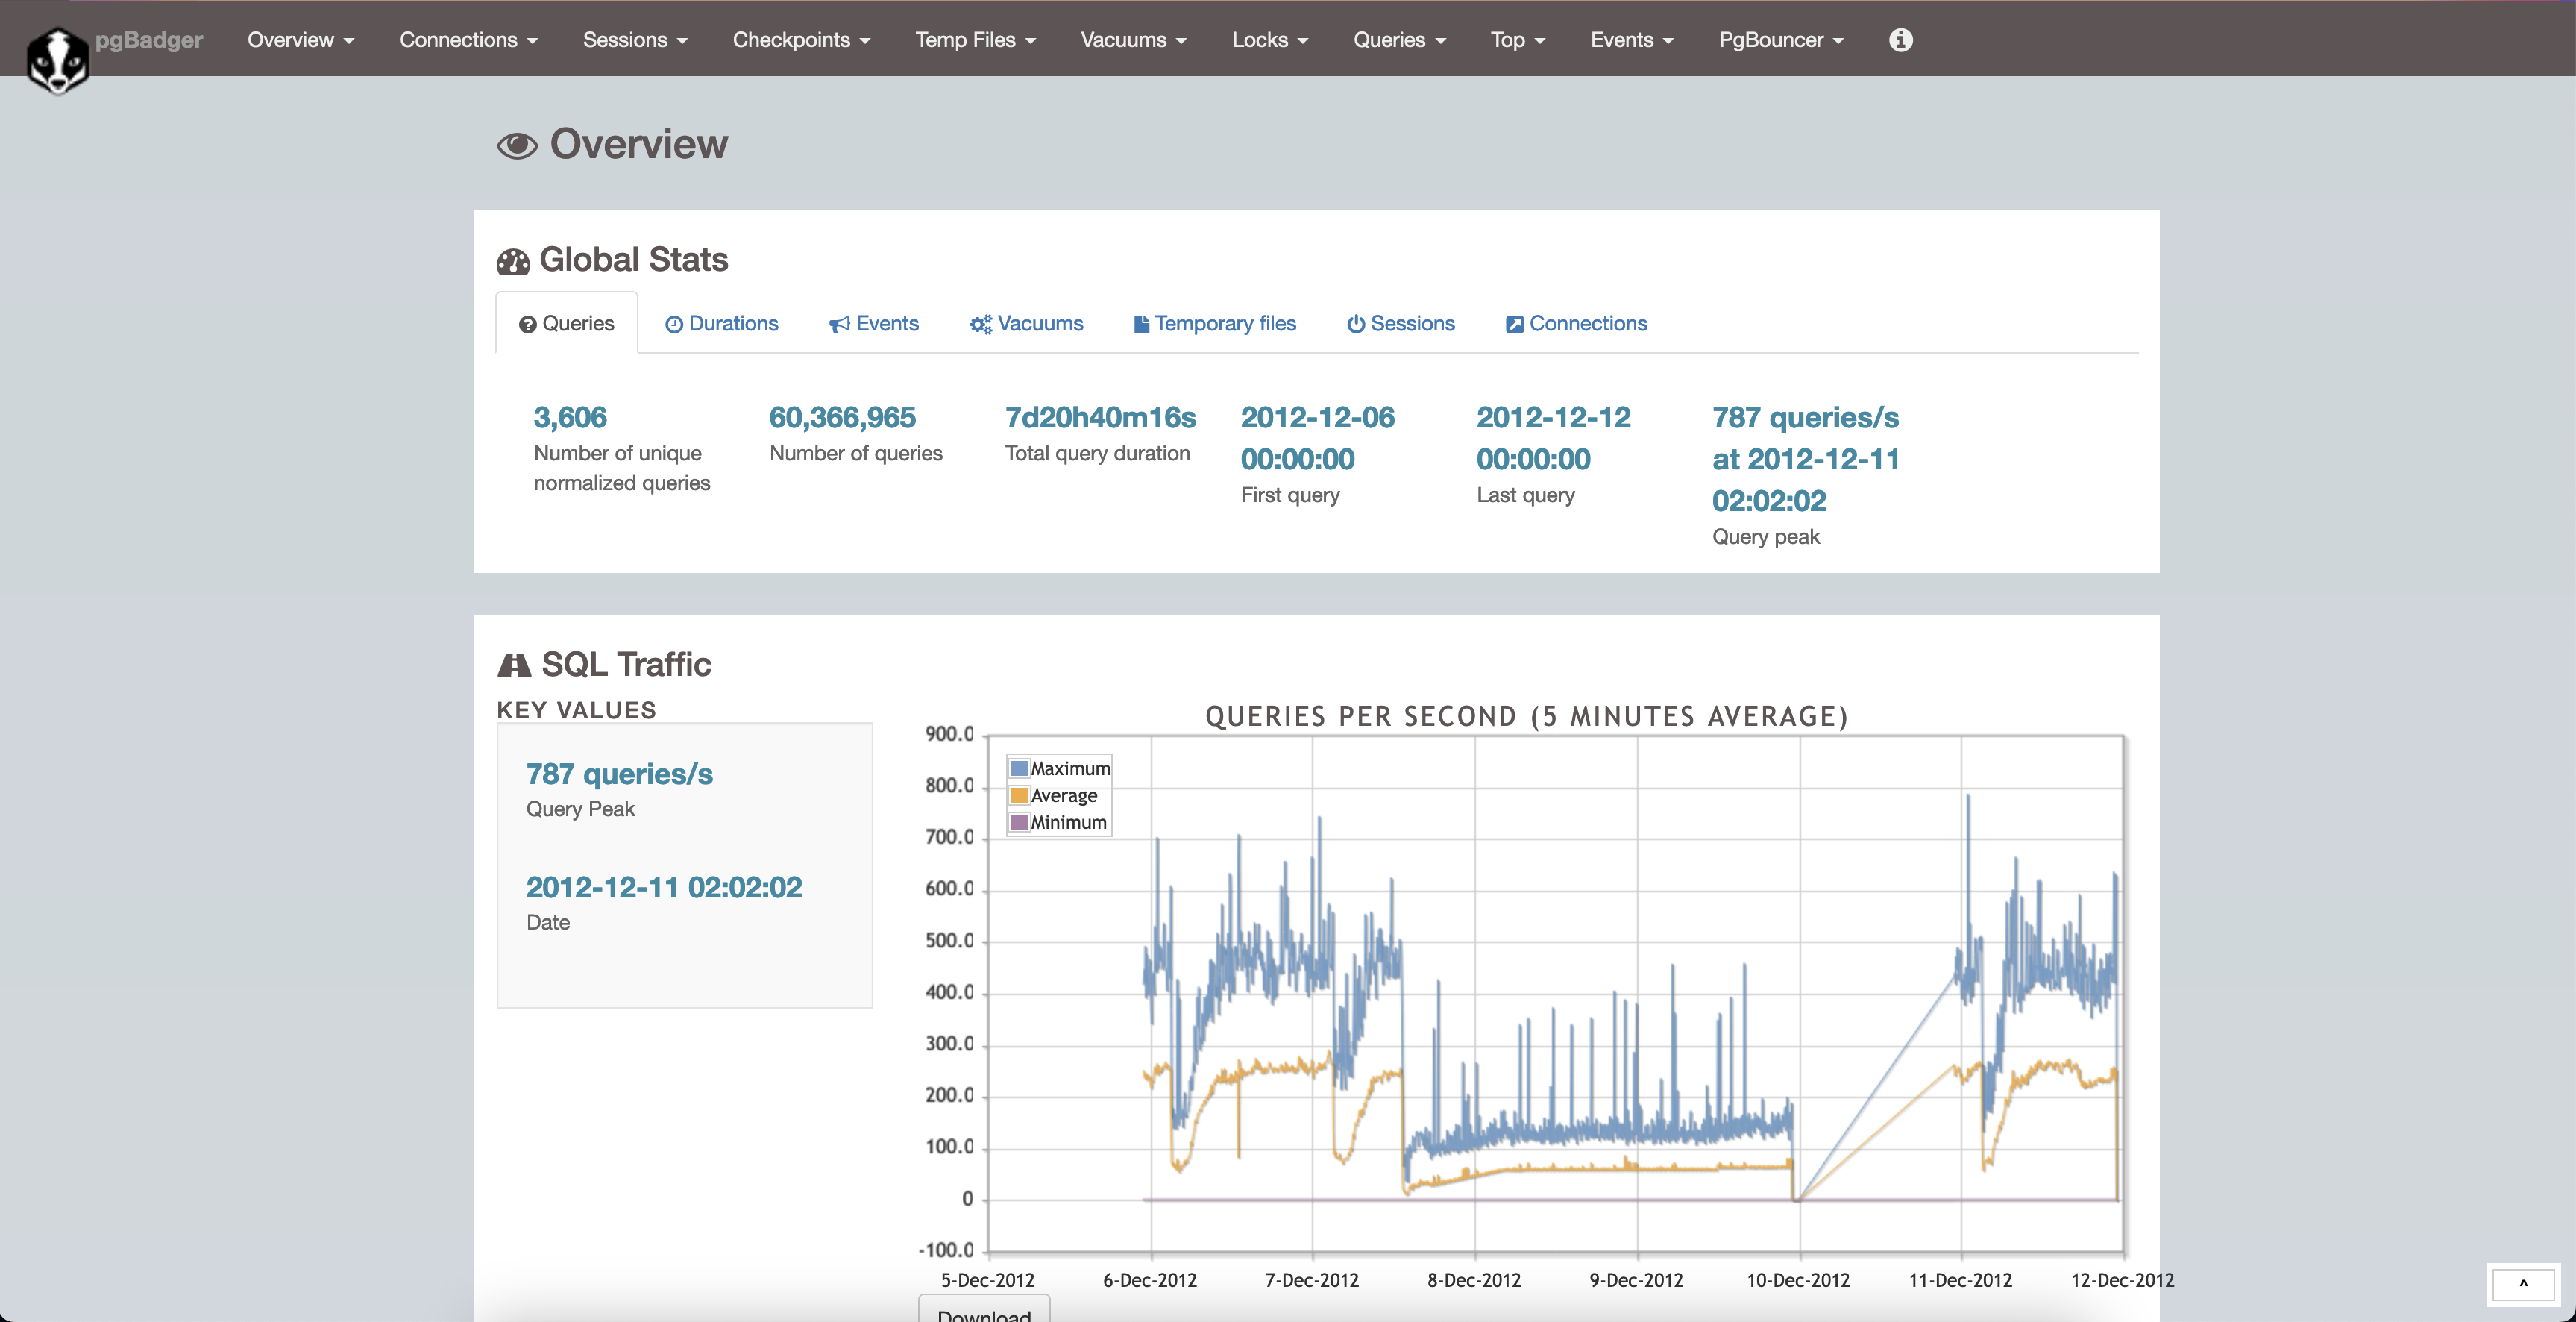
It has heaps of information. You can see the top queries, slow queries, errors, etc.
Conclusion#
pgBadger is a great tool to analyze postgresql query logs. It is easy to use and provides a lot of information. It is a must-have tool for any postgresql developer.